StockAggregator
Market analytics dashboard · solo build
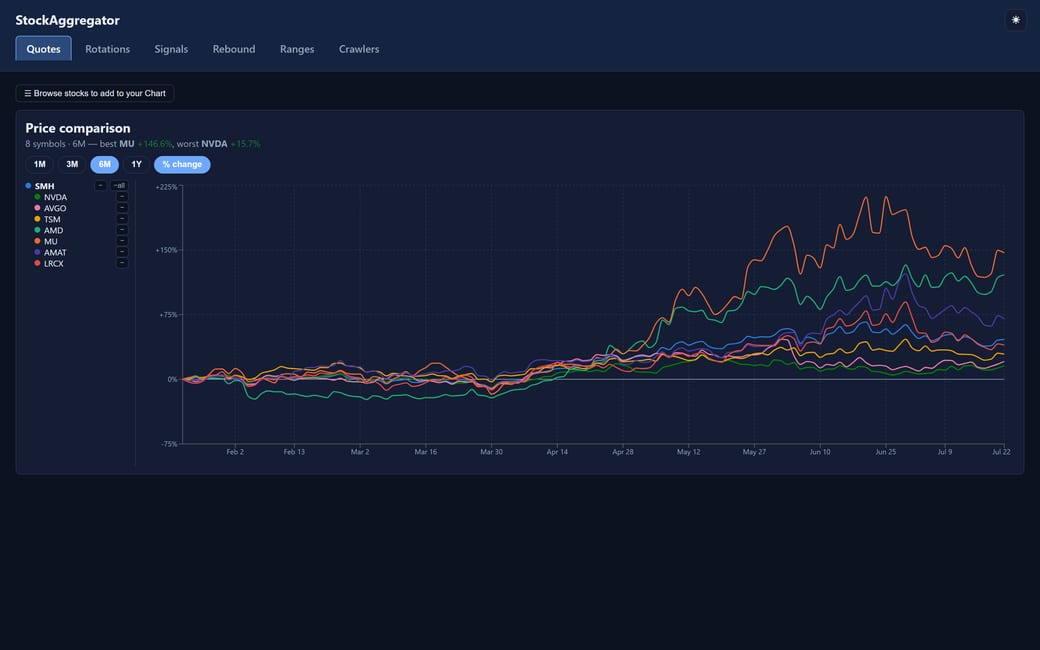
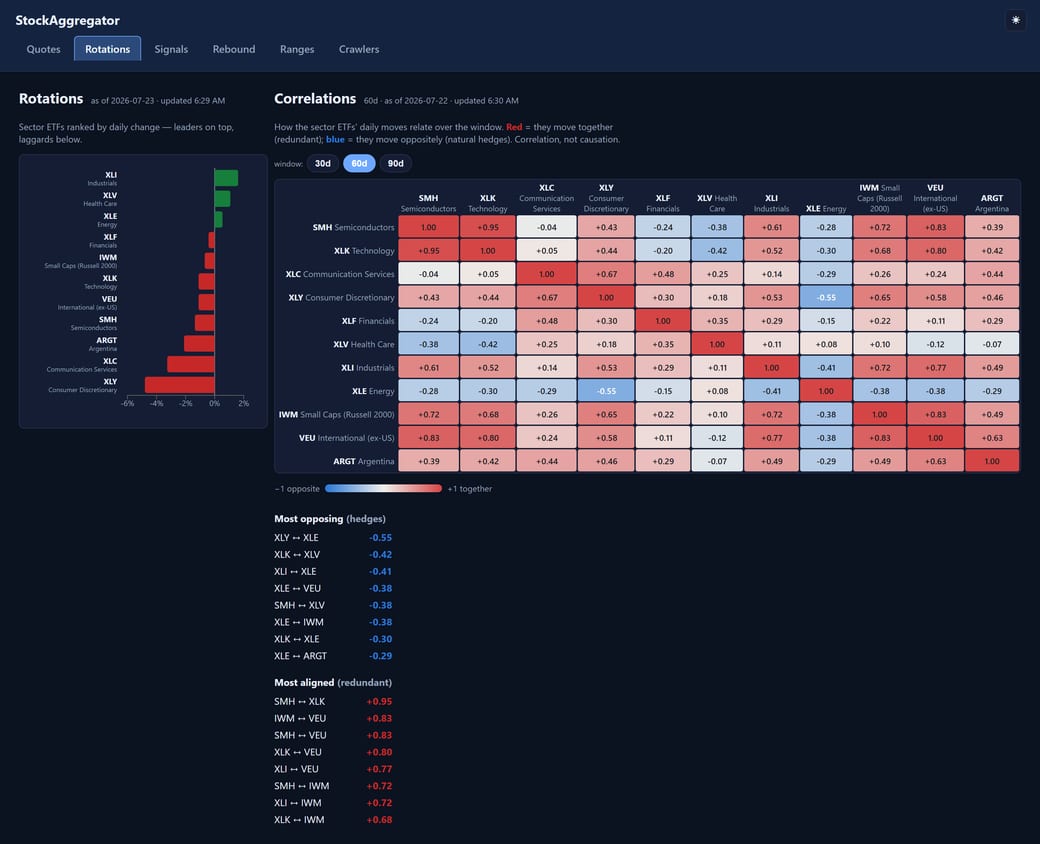
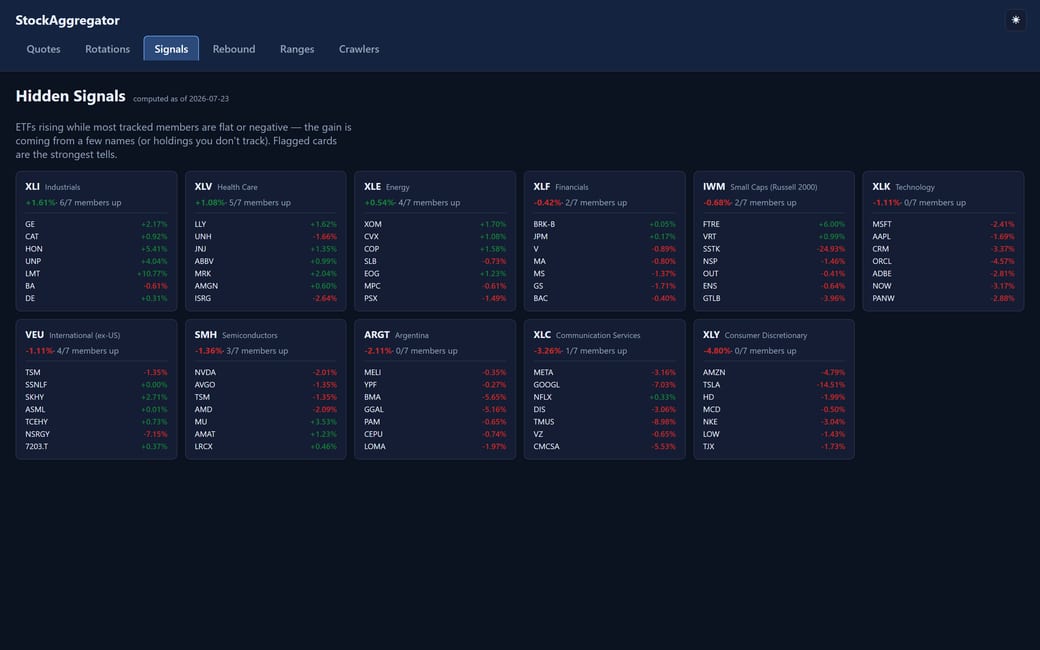
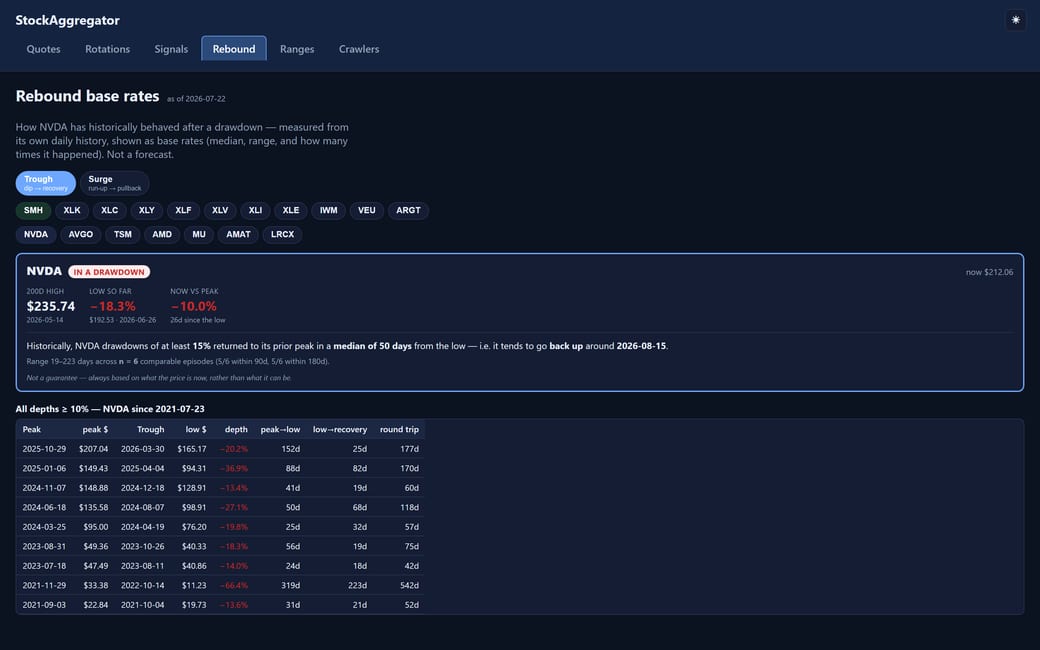
A .NET service that ingests daily market snapshots into Azure SQL and computes the analytics on top of them: a seasonality calendar, sector-rotation views, rebound and range statistics, and a correlation matrix. Four timed snapshots a day, a nightly rollup that derives the numbers, and a read-only API the React dashboard reads from: nothing is computed while you wait for a page.
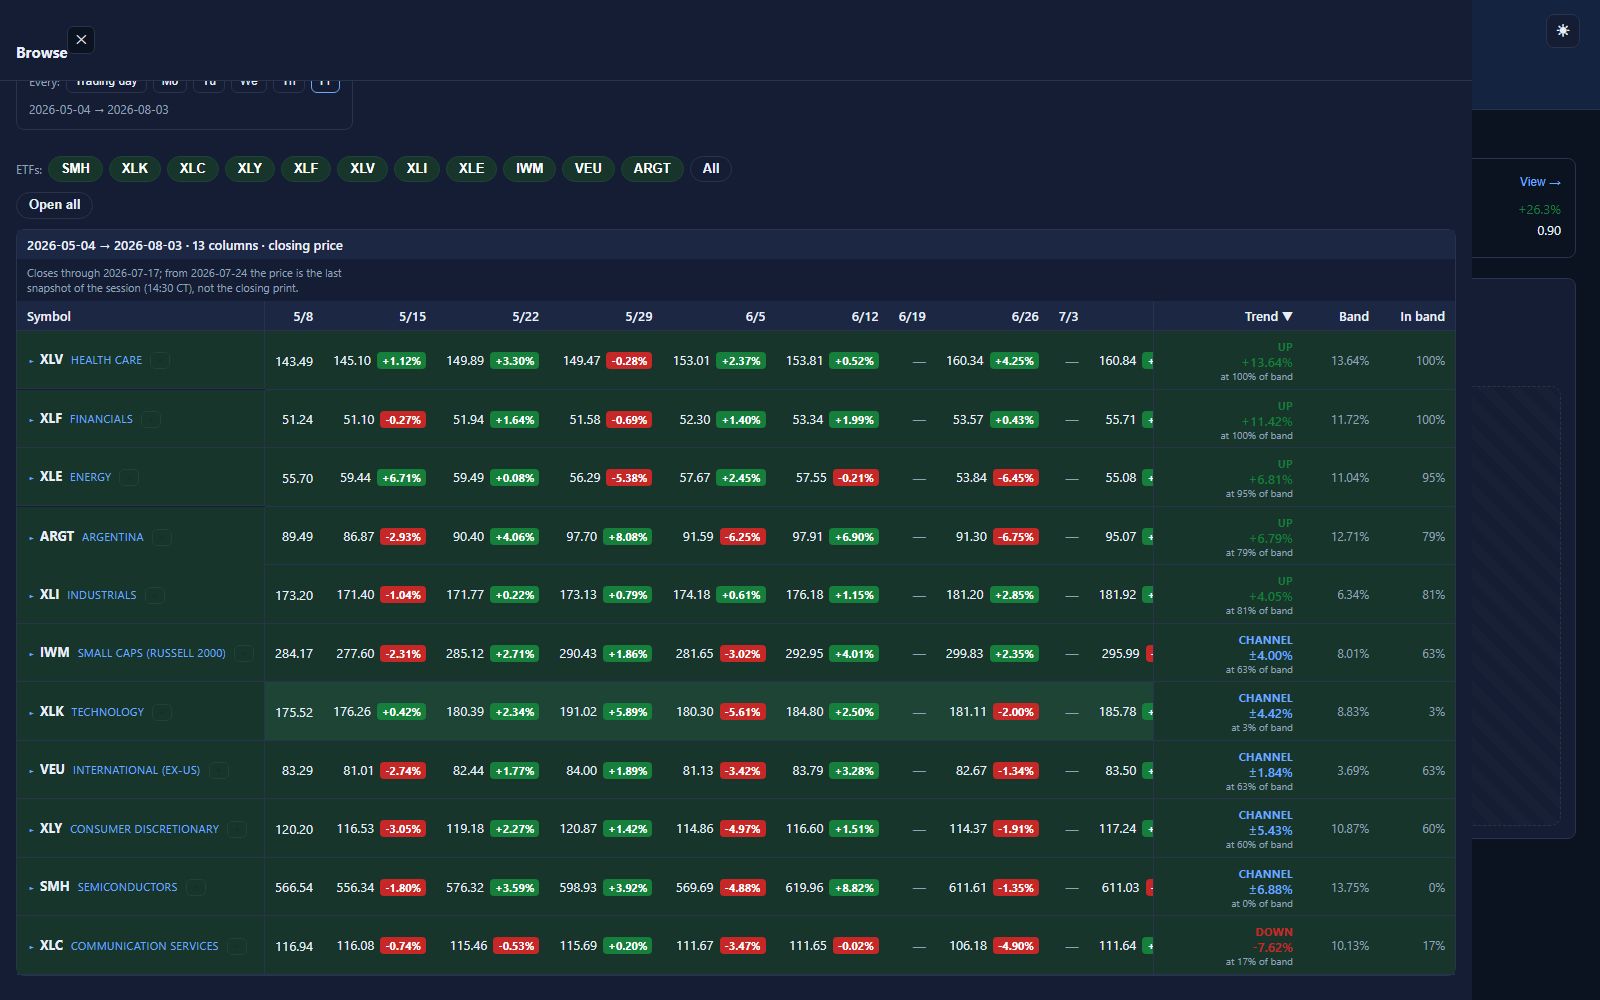
Pick any date span and every symbol gets a plain verdict on how it behaved across it, Up +6.8%, Down −7.6%, or Channel ±4.4%, plus where its last close sits inside that high-low band. A move only counts as a trend if it clears 2% and covers half the band; otherwise it's channeling. Fidelity and Schwab will draw you the chart. Neither will put the price action side by side, in a table, across a range you picked. It stops there on purpose: channeling near the bottom of its band suits a mean-reversion trader, a strong move near the top suits a momentum one. The tool describes; the call stays yours.

public SqlConnection Create()
{
    var connection = new SqlConnection(_connectionString)
    {
        // Azure SQL serverless auto-pauses when idle; the first connection after a
        // pause triggers a resume that can outlast the connection timeout, so a lone
        // attempt fails — this is why scheduled snapshots occasionally didn't save.
        RetryLogicProvider = _openRetryProvider,
    };

    if (_useEntraToken && _credential is { } credential)
    {
        // SqlClient dropped the built-in Entra providers, so attach a token via
        // AccessTokenCallback: managed identity in Azure, az login locally.
        connection.AccessTokenCallback = async (_, ct) =>
        {
            var token = await credential.GetTokenAsync(
                new TokenRequestContext(new[] { DatabaseScope }), ct);
            return new SqlAuthenticationToken(token.Token, token.ExpiresOn);
        };
    }

    return connection;
}

// Exponential backoff tuned for serverless resume — retry the resume/transient
// error numbers (40613 "database not currently available", the 4919x busy codes,
// -2 connection timeout) a few times, giving a slow resume room to finish.
private static SqlRetryLogicBaseProvider BuildOpenRetryProvider() =>
    SqlConfigurableRetryFactory.CreateExponentialRetryProvider(new SqlRetryLogicOption
    {
        NumberOfTries   = 4,
        DeltaTime       = TimeSpan.FromSeconds(4),
        MaxTimeInterval = TimeSpan.FromSeconds(20),
        TransientErrors = { -2, 40613, 40197, 40501, 40540, 49918, 49919, 49920 },
    });
Why this one: it's the seam between three real constraints , passwordless Entra auth, a cost-saving serverless database that pauses, and a scheduled job that must not silently lose data. The retry provider is what turned "snapshots occasionally didn't save" into "they always land."
Eight Playwright tests drive the built UI against the live API and Azure SQL: no mocks. A render-and-flow net: every dashboard route asserts it renders, and the quotes flow is walked end to end to a drawn chart. Because it hits real data, the chart-render check is timing-sensitive on a cold serverless database, and it is left failing here on purpose. Padding the timeout until it always went green would hide the cold-start cost rather than measure it, and the run below is the one the suite actually produced.
storage Azure SQL serverless auto-pauses when idle to keep cost near zero; the first query after a pause outran the connection timeout, so scheduled snapshots occasionally didn't save. Fixed with backoff-retry on connect plus an idempotent catch-up that re-runs a missed capture only when no rows exist for it yet: never duplicating, and sparse enough that the database still gets to pause.
ingestion Quotes come from Yahoo's public chart endpoint, swapped in for a paid quote API, so there's no key and no quota. The cost is no SLA, so a failed ticker is logged and skipped rather than sinking the whole run.
delivery I like the design, and I still rarely visited the site. So I added the thing I would actually look at every day: a midday email with the strongest and weakest sectors and anything sitting at a one-month high.